
Here we have mentioned most frequently asked Tableau Interview Questions and Answers specially for freshers and experienced.
1. What is Tableau?
Ans:
Tableau is a business intelligence software that allows anyone to connect to respective data, and then visualize and create interactive, shareable dashboards.
2. What are the different Tableau Products and what is the latest version of Tableau?
Ans:
Here is the Tableau Product family.
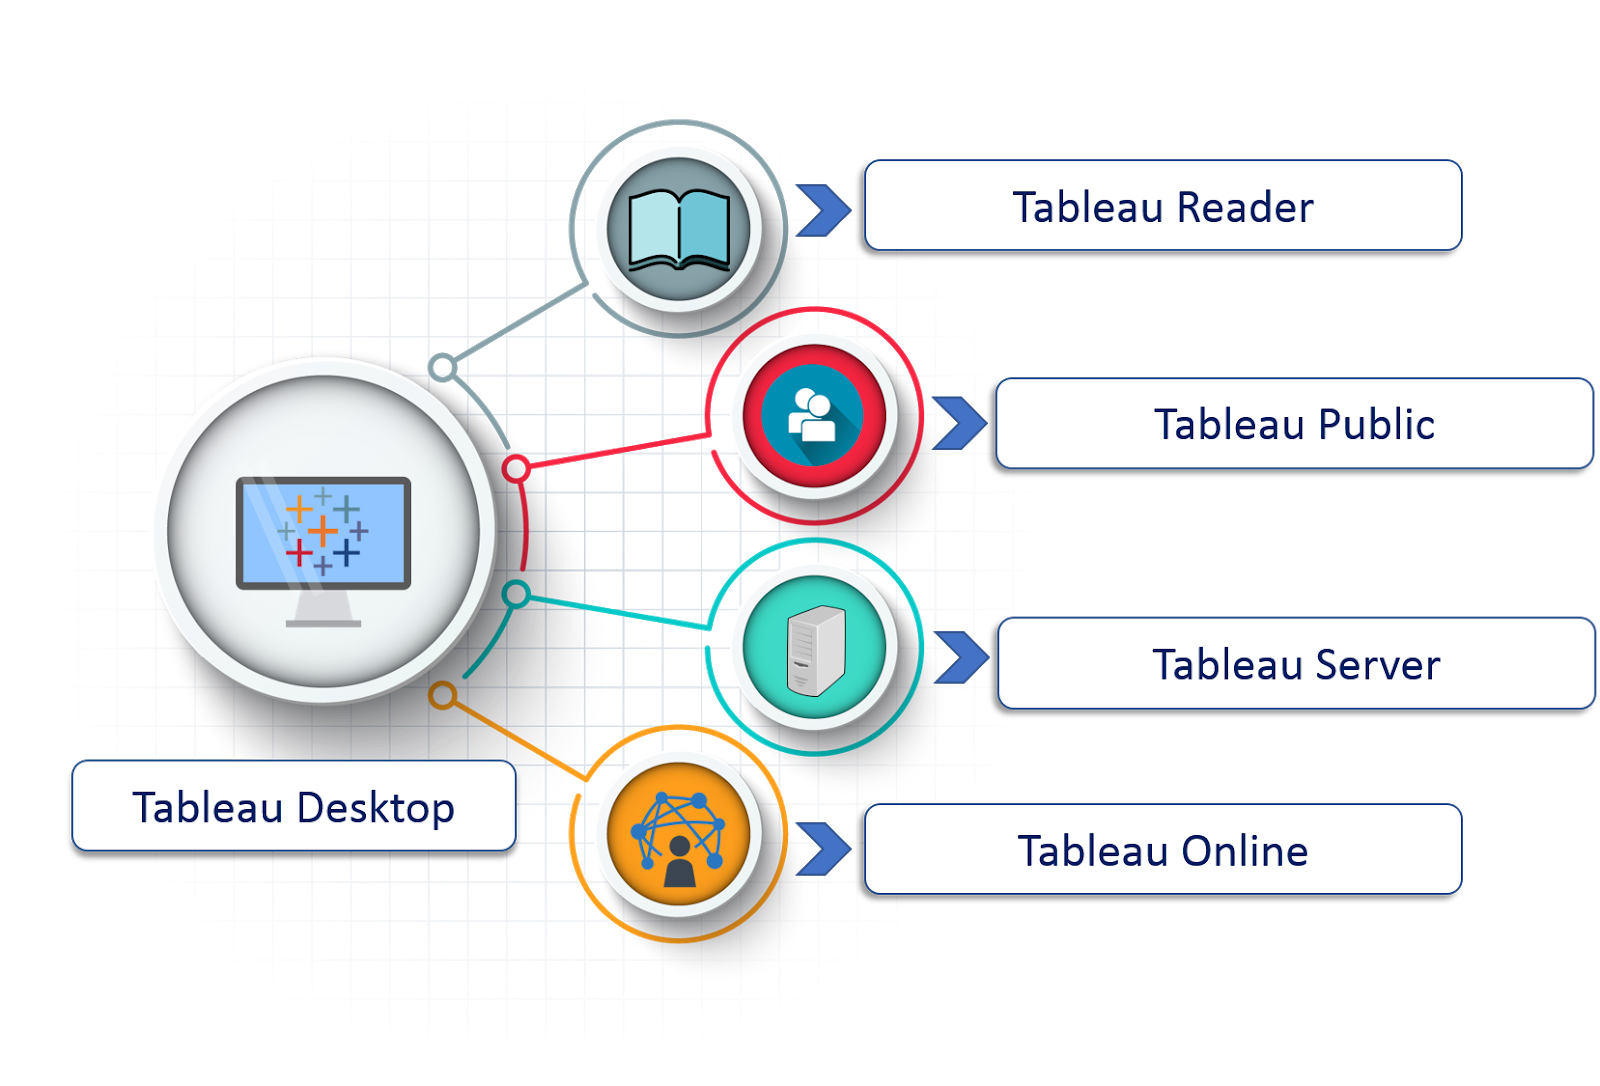
Tableau Desktop:
It is a self service business analytics and data visualization that anyone can use. It translates pictures of data into optimized queries. With tableau desktop, you can directly connect to data from your data warehouse for live upto date data analysis. You can also perform queries without writing a single line of code. Import all your data into Tableau’s data engine from multiple sources & integrate altogether by combining multiple views in a interactive dashboard.
Tableau Server:
It is more of a enterprise level Tableau software. You can publish dashboards with Tableau Desktop and share them throughout the organization with web-based Tableau server. It leverages fast databases through live connections.
Tableau Online:
This is a hosted version of Tableau server which helps makes business intelligence faster and easier than before. You can publish Tableau dashboards with Tableau Desktop and share them with colleagues.
Tableau Reader:
It’s a free desktop application that enables you to open and view visualizations that are built in Tableau Desktop. You can filter, drill down data but you cannot edit or perform any kind of interactions.
Tableau Public:
This is a free Tableau software which you can use to make visualizations with but you need to save your workbook or worksheets in the Tableau Server which can be viewed by anyone.
3. What are the different datatypes in Tableau?
Ans:
Tableau supports the following data-types:

4. What are Measures and Dimensions?
Ans:
Measures are the numeric metrics or measurable quantities of the data, which can be analyzed by dimension table. Measures are stored in a table that contain foreign keys referring uniquely to the associated dimension tables. The table supports data storage at atomic level and thus, allows more number of records to be inserted at one time. For instance, a Sales table can have product key, customer key, promotion key, items sold, referring to a specific event.
Dimensions are the descriptive attribute values for multiple dimensions of each attribute, defining multiple characteristics. A dimension table ,having reference of a product key form the table, can consist of product name, product type, size, color, description, etc.
5. What is the difference between .twb and .twbx extension?
Ans:
A .twb is an xml document which contains all the selections and layout made you have made in your Tableau workbook. It does not contain any data.
A .twbx is a ‘zipped’ archive containing a .twb and any external files such as extracts and background images.
6. What is the difference between Tableau and Traditional BI Tools?
Ans:
Tableau provides easy to use, best in class, visual analytic capabilities but has nothing to do with the data foundation or plumbing. But with an integration with a SQL server it can be the complete package.
On the other hand traditional BI tools have the before mentioned capabilities but then you have to deal with significant amount of upfront costs. The cost of consulting, software and hardware is comparatively quite high.
7. What are the different types of joins in Tableau?
Ans:
The joins in Tableau are same as SQL joins. Take a look at the diagram below to understand it.

8. How many maximum tables can you join in Tableau?
Ans:
You can join a maximum of 32 tables in Tableau.
9. What are the different connections you can make with your dataset?
Ans:
We can either connect live to our data set or extract data onto Tableau.
Live: Connecting live to a data set leverages its computational processing and storage. New queries will go to the database and will be reflected as new or updated within the data.
Extract: An extract will make a static snapshot of the data to be used by Tableau’s data engine. The snapshot of the data can be refreshed on a recurring schedule as a whole or incrementally append data. One way to set up these schedules is via the Tableau server.
The benefit of Tableau extract over live connection is that extract can be used anywhere without any connection and you can build your own visualization without connecting to database.
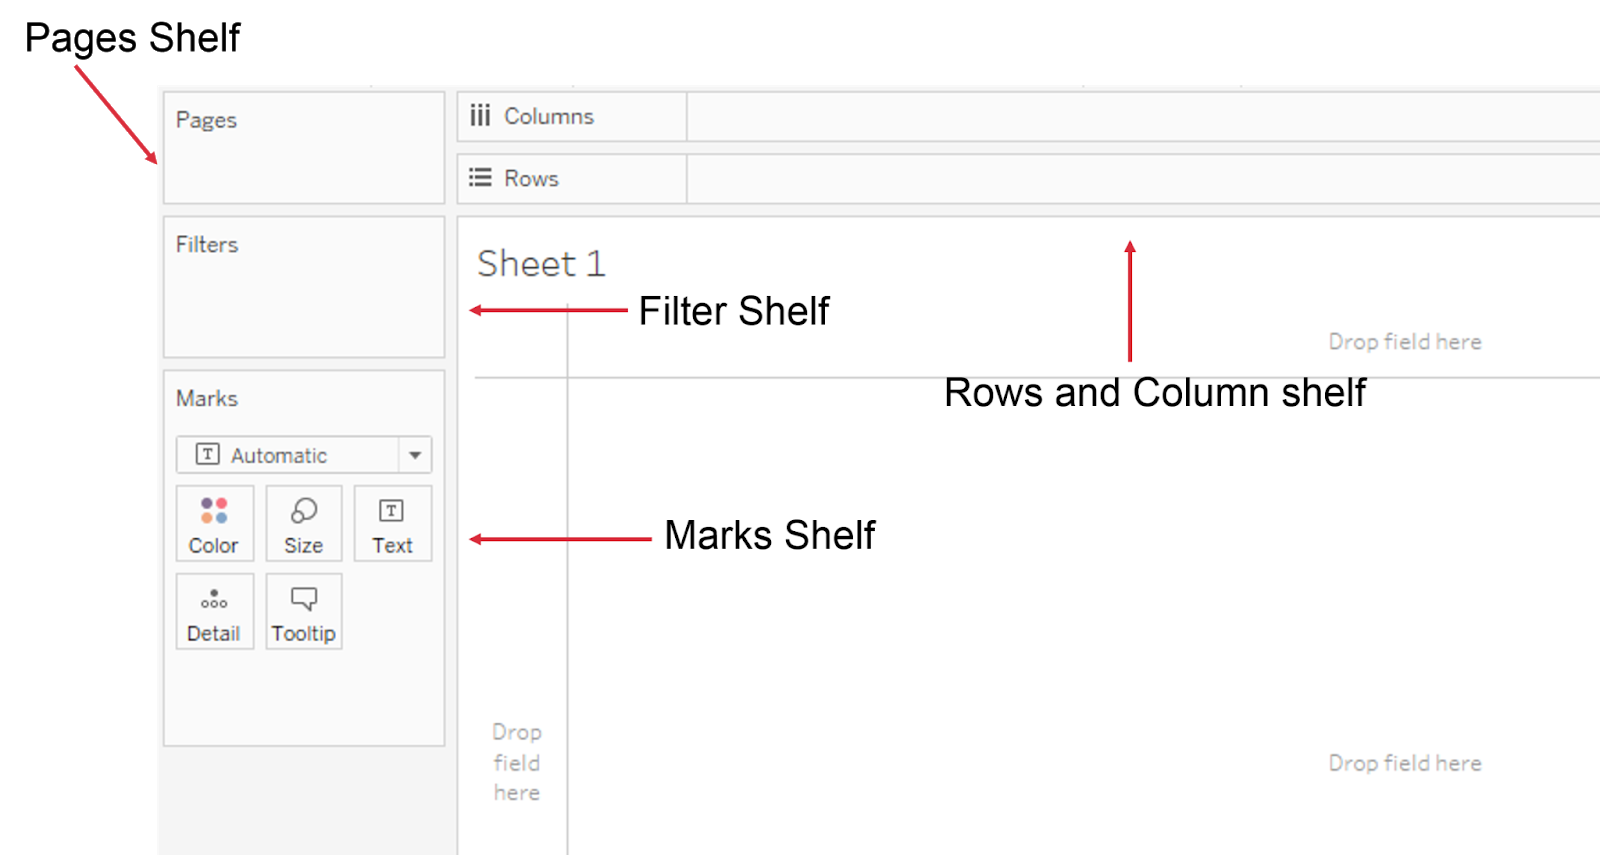
10. What are shelves?
Ans:
They are Named areas to the left and top of the view. You build views by placing fields onto the shelves. Some shelves are available only when you select certain mark types.
11. What are sets?
Ans:
Sets are custom fields that define a subset of data based on some conditions. A set can be based on a computed condition, for example, a set may contain customers with sales over a certain threshold. Computedsets update as your data changes. Alternatively, a set can be based on specific data point in your view.
12. What are groups?
Ans:
A group is a combination of dimension members that make higher level categories. For example, if you are working with a view that shows average test scores by major, you may want to group certain majors together to create major categories.
13. What is a hierarchical field?
Ans:
A hierarchical field in tableau is used for drilling down data. It means viewing your data in a more granular level.
14. What is Tableau Data Server?
Ans:
Tableau server acts a middle man between Tableau users and the data. Tableau Data Server allows you to upload and share data extracts, preserve database connections, as well as reuse calculations and field metadata. This means any changes you make to the data-set, calculated fields, parameters, aliases, or definitions, can be saved and shared with others, allowing for a secure, centrally managed and standardized dataset. Additionally, you can leverage your server’s resources to run queries on extracts without having to first transfer them to your local machine.
15. What is Tableau Data Engine?
Ans:
Tableau Data Engine is a really cool feature in Tableau. Its an analytical database designed to achieve instant query response, predictive performance, integrate seamlessly into existing data infrastructure and is not limited to load entire data sets into memory.
If you work with a large amount of data, it does takes some time to import, create indexes and sort data but after that everything speeds up. Tableau Data Engine is not really in-memory technology. The data is stored in disk after it is imported and the RAM is hardly utilized.
16. What are the different filters in Tableau and how are they different from each other?
Ans:
In Tableau, filters are used to restrict the data from database.
The different filters in Tableau are: Quick , Context and Normal/Traditional filter are:
- Normal Filter is used to restrict the data from database based on selected dimension or measure. A Traditional Filter can be created by simply dragging a field onto the ‘Filters’ shelf.
- Quick filter is used to view the filtering options and filter each worksheet on a dashboard while changing the values dynamically (within the range defined) during the run time.
- Context Filter is used to filter the data that is transferred to each individual worksheet. When a worksheet queries the data source, it creates a temporary, flat table that is uses to compute the chart. This temporary table includes all values that are not filtered out by either the Custom SQL or the Context Filter.
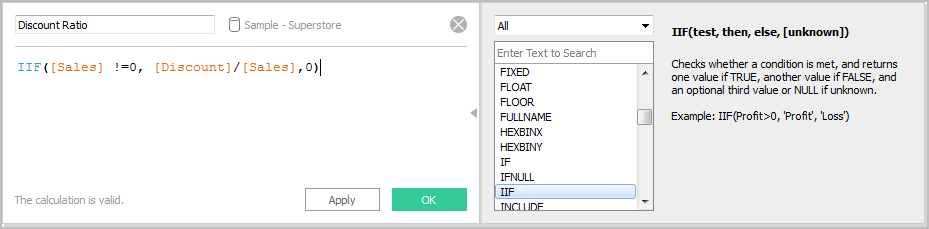
17. How to create a calculated field in Tableau?
Ans:
Click the drop down to the right of Dimensions on the Data pane and select “Create > Calculated Field” to open the calculation editor.
Name the new field and create a formula.
Take a look at the example below:
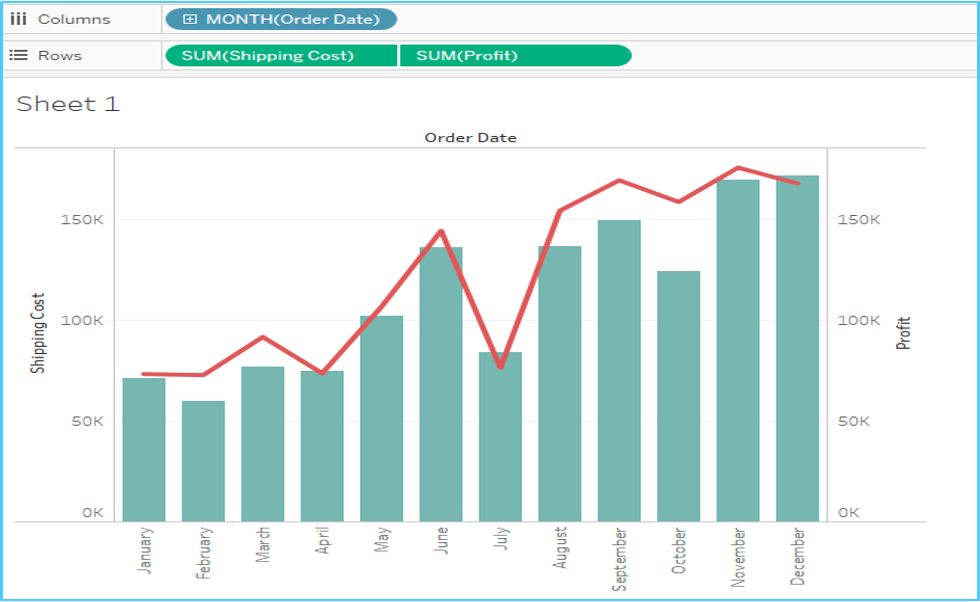
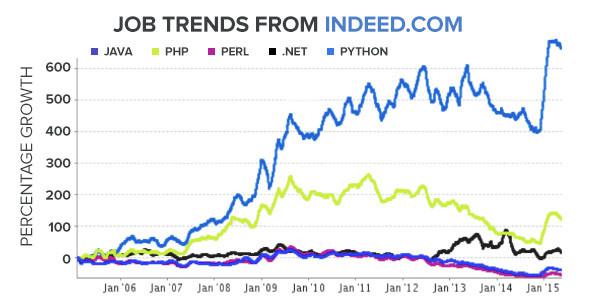
18. What is a dual axis?
Ans:
Dual Axis is an excellent phenomenon supported by Tableau that helps users view two scales of two measures in the same graph. Many websites like Indeed.com and other make use of dual axis to show the comparison between two measures and their growth rate in a septic set of years. Dual axes let you compare multiple measures at once, having two independent axes layered on top of one another. This is how it looks like:
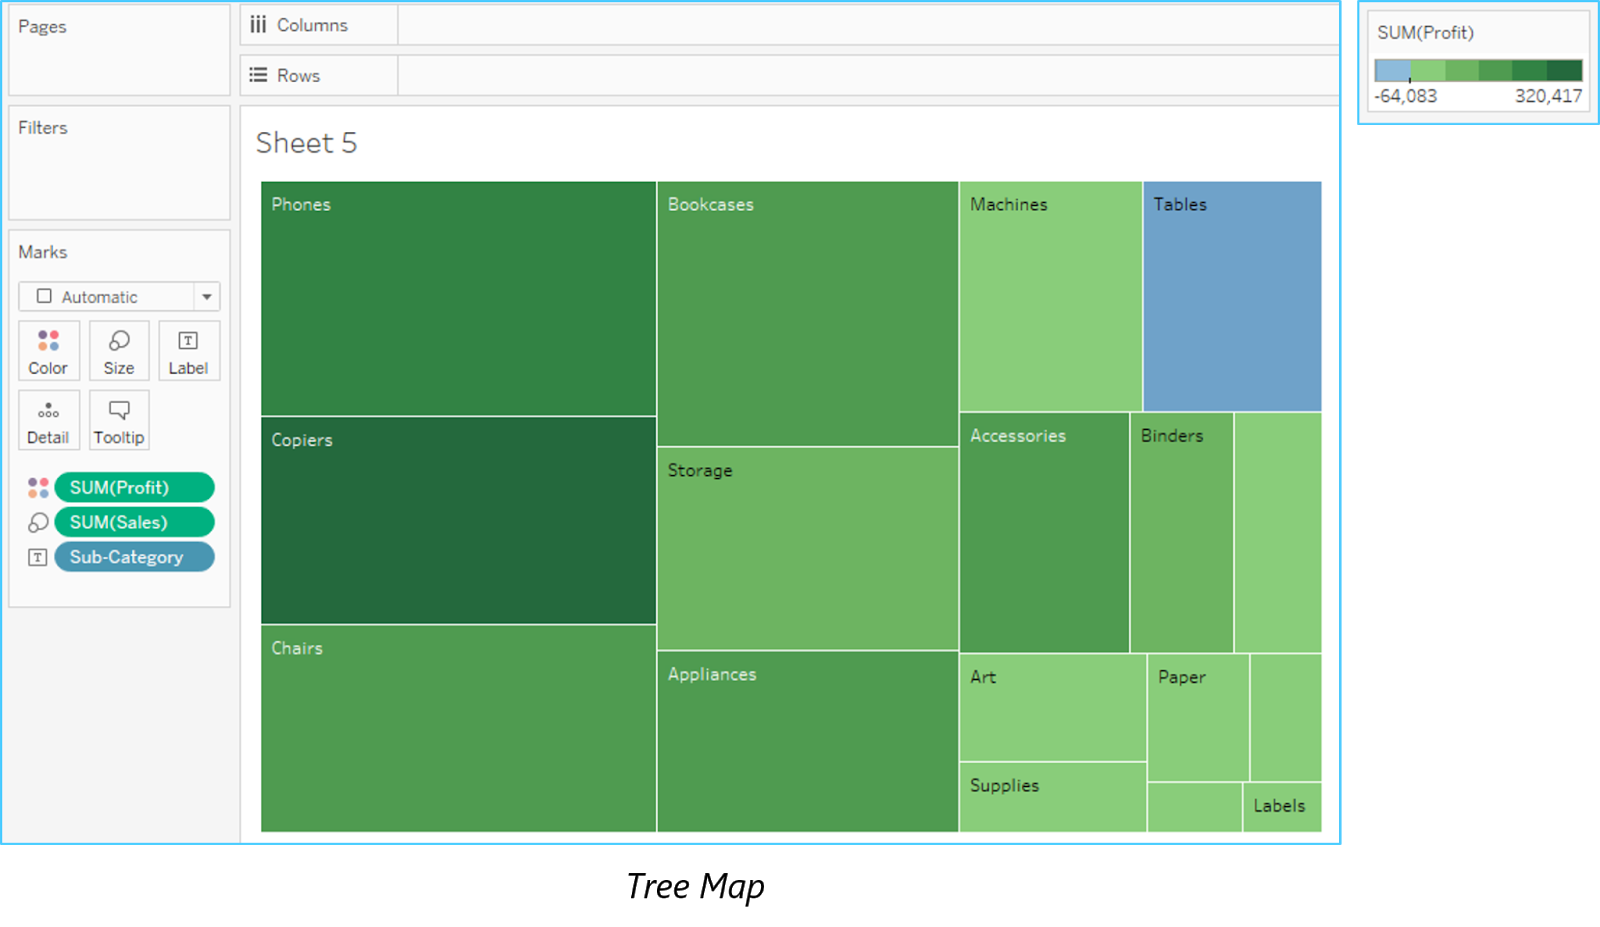
19. What is the difference between a tree map and heat map?
Ans:
A heat map can be used for comparing categories with color and size. With heat maps, you can compare two different measures together.
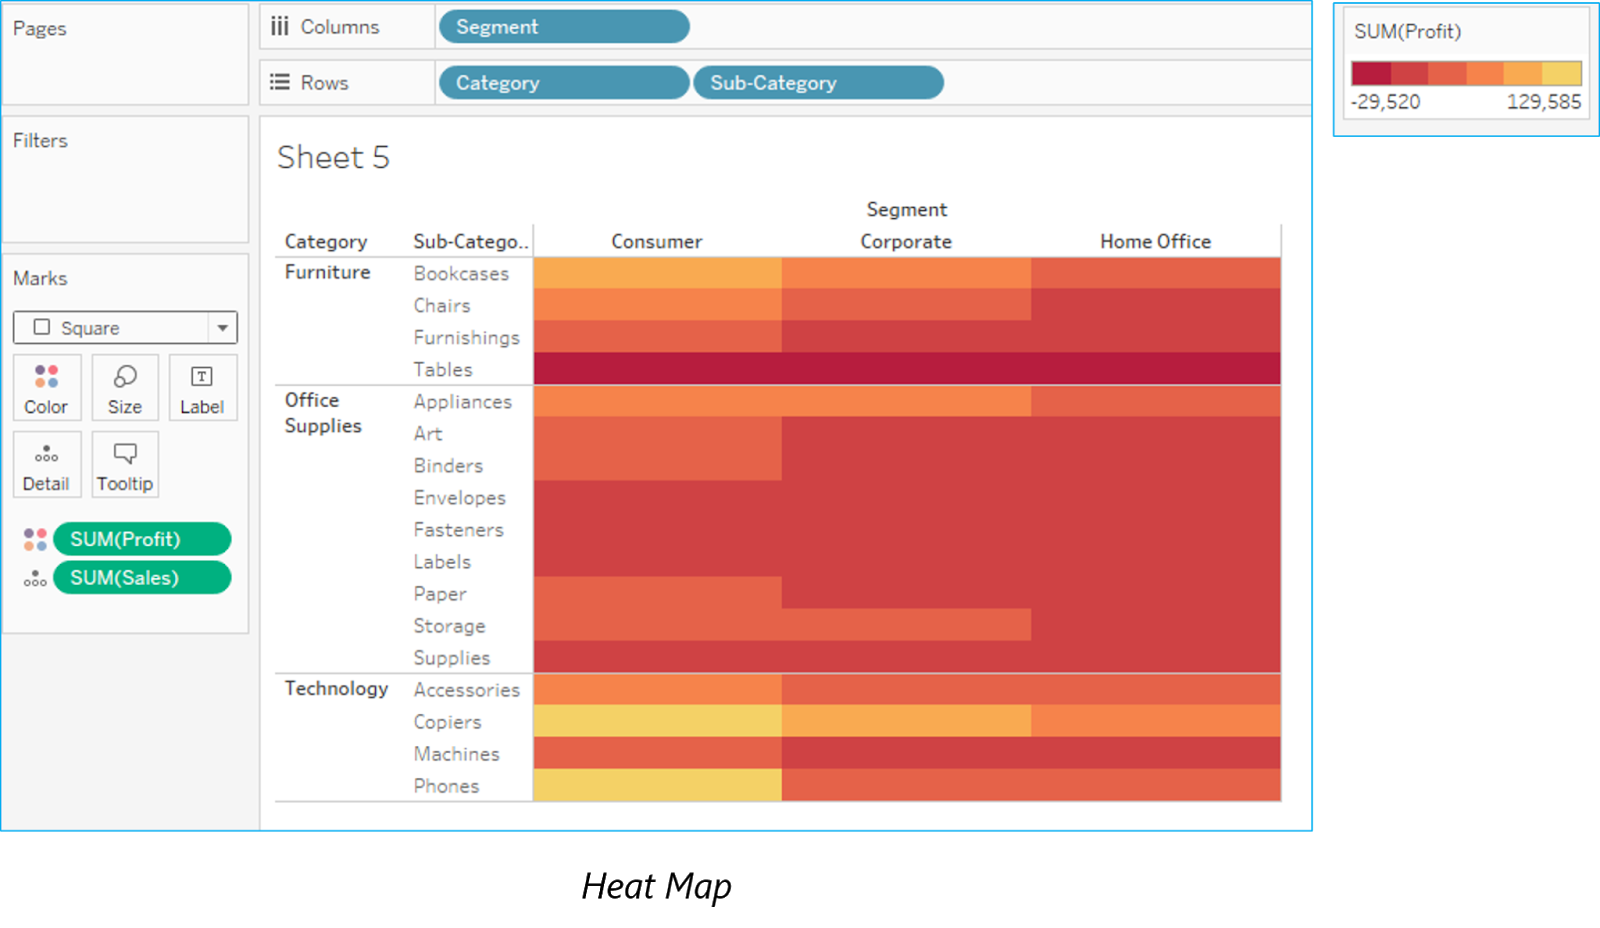
A tree map also does the same except it is considered a very powerful visualization as it can be used for illustrating hierarchical data and part-to-whole relationships.
20. What is disaggregation and aggregation of data?
Ans:
The process of viewing numeric values or measures at higher and more summarized levels of the data is called aggregation. When you place a measure on a shelf, Tableau automatically aggregates the data, usually by summing it. You can easily determine the aggregation applied to a field because the function always appears in front of the field’s name when it is placed on a shelf. For example, Sales becomes SUM(Sales). You can aggregate measures using Tableau only for relational data sources. Multidimensional data sources contain aggregated data only. In Tableau, multidimensional data sources are supported only in Windows.
According to Tableau, Disaggregating your data allows you to view every row of the data source which can be useful when you are analyzing measures that you may want to use both independently and dependently in the view. For example, you may be analyzing the results from a product satisfaction survey with the Age of participants along one axis. You can aggregate the Age field to determine the average age of participants or disaggregate the data to determine at what age participants were most satisfied with the product.
21. What is the difference between joining and blending in Tableau?
Ans:
Joining term is used when you are combining data from the same source, for example, worksheet in an Excel file or tables in Oracle database
While blending requires two completely defined data sources in your report.
22. What are Extracts and Schedules in Tableau server?
Ans:
Data extracts are the first copies or subdivisions of the actual data from original data sources. The workbooks using data extracts instead of those using live DB connections are faster since the extracted data is imported in Tableau Engine.After this extraction of data, users can publish the workbook, which also publishes the extracts in Tableau Server. However, the workbook and extracts won’t refresh unless users apply a scheduled refresh on the extract. Scheduled Refreshes are the scheduling tasks set for data extract refresh so that they get refreshed automatically while publishing a workbook with data extract. This also removes the burden of republishing the workbook every time the concerned data gets updated.
23. How to view underlying SQL Queries in Tableau?
Ans:
Viewing underlying SQL Queries in Tableau provides two options:
Create a Performance Recording to record performance information about the main events you interact with workbook. Users can view the performance metrics in a workbook created by Tableau.
Help -> Settings and Performance -> Start Performance Recording
Help -> Setting and Performance -> Stop Performance Recording.
Reviewing the Tableau Desktop Logs located at C:\Users\\My Documents\My Tableau Repository. For live connection to data source, you can check log.txt and tabprotosrv.txt files. For an extract, check tdeserver.txt file.
24. How to do Performance Testing in Tableau?
Ans:
Performance testing is again an important part of implementing tableau. This can be done by loading Testing Tableau Server with TabJolt, which is a “Point and Run” load generator created to perform QA. While TabJolt is not supported by tableau directly, it has to be installed using other open source products.
25. Name the components of a Dashboard.
Ans:
Horizontal – Horizontal layout containers allow the designer to group worksheets and dashboard components left to right across your page and edit the height of all elements at once.
Vertical – Vertical containers allow the user to group worksheets and dashboard components top to bottom down your page and edit the width of all elements at once.
Text – All textual fields.
Image Extract – A Tableau workbook is in XML format. In order to extracts images, Tableau applies some codes to extract an image which can be stored in XML.
Web [URL ACTION] – A URL action is a hyperlink that points to a Web page, file, or other web-based resource outside of Tableau. You can use URL actions to link to more information about your data that may be hosted outside of your data source. To make the link relevant to your data, you can substitute field values of a selection into the URL as parameters.
26. How to remove ‘All’ options from a Tableau auto-filter?
Ans:
The auto-filter provides a feature of removing ‘All’ options by simply clicking the down arrow in the auto-filter heading. You can scroll down to ‘Customize’ in the dropdown and then uncheck the ‘Show “All” Value’ attribute. It can be activated by checking the field again.
27. How to add Custom Color to Tableau?
Ans:
Adding a Custom Color refers to a power tool in Tableau. Restart you Tableau desktop once you save .tps file. From the Measures pane, drag the one you want to add color to Color. From the color legend menu arrow, select Edit Colors. When a dialog box opens, select the palette drop-down list and customize as per requirement.
28. What is TDE file?
Ans:
TDE is a Tableau desktop file that contains a .tde extension. It refers to the file that contains data extracted from external sources like MS Excel, MS Access or CSV file.
There are two aspects of TDE design that make them ideal for supporting analytics and data discovery.
Firstly, TDE is a columnar store.
The second is how they are structured which impacts how they are loaded into memory and used by Tableau. This is an important aspect of how TDEs are “architecture aware”. Architecture-awareness means that TDEs use all parts of your computer memory, from RAM to hard disk, and put each part to work what best fits its characteristics.
29. Mention whether you can create relational joins in Tableau without creating a new table?
Ans:
Yes, one can create relational joins in tableau without creating a new table.
30. How to automate reports?
Ans:
You need to publish report to tableau server, while publishing you will find one option to schedule reports.You just need to select the time when you want to refresh data.
31. What is Assume referential integrity?
Ans:
In some cases, you can improve query performance by selecting the option to Assume Referential Integrity from the Data menu. When you use this option, Tableau will include the joined table in the query only if it is specifically referenced by fields in the view.
32. Explain when would you use Joins vs. Blending in Tableau?
Ans:
If data resides in a single source, it is always desirable to use Joins. When your data is not in one place blending is the most viable way to create a left join like the connection between your primary and secondary data sources.
33. What is default Data Blending Join?
Ans:
Data blending is the ability to bring data from multiple data sources into one Tableau view, without the need for any special coding. A default blend is equivalent to a left outer join. However, by switching which data source is primary, or by filtering nulls, it is possible to emulate left, right and inner joins.
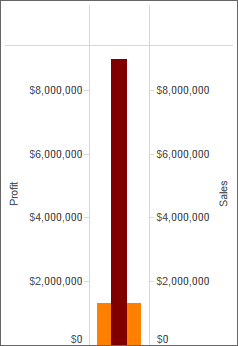
34. What do you understand by blended axis?
Ans:
In Tableau, measures can share a single axis so that all the marks are shown in a single pane. Instead of adding rows and columns to the view, when you blend measures there is a single row or column and all of the values for each measure is shown along one continuous axis. We can blend multiple measures by simply dragging one measure or axis and dropping it onto an existing axis.
35. What is story in Tableau?
Ans:
A story is a sheet that contains a sequence of worksheets or dashboards that work together to convey information. You can create stories to show how facts are connected, provide context, demonstrate how decisions relate to outcomes, or simply make a compelling case. Each individual sheet in a story is called a story point.
36. What is the difference between discrete and continuous in Tableau?
Ans:
There are two types of data roles in Tableau – discrete and continuous dimension.
- Discrete data roles are values that are counted as distinct and separate and can only take individual values within a range. Examples: number of threads in a sheet, customer name or row ID or State. Discrete values are shown as blue pills on the shelves and blue icons in the data window.
- Continuous data roles are used to measure continuous data and can take on any value within a finite or infinite interval. Examples: unit price, time and profit or order quantity.
- Continuous variables behave in a similar way in that they can take on any value. Continuous values are shown as green pills.
37.How to create stories in Tableau?
Ans:
There are many ways to create story in Tableau. Each story point can be based on a different view or dashboard, or the entire story can be based on the same visualization, just seen at different stages, with different marks filtered and annotations added. You can use stories to make a business case or to simply narrate a sequence of events.
- Click the New Story tab.
- In the lower-left corner of the screen, choose a size for your story. Choose from one of the predefined sizes, or set a custom size, in pixels.
- By default, your story gets its title from its sheet name. To edit it, double-click the title. You can also change your title’s font, color, and alignment. Click Apply to view your changes.
- To start building your story, drag a sheet from the Story tab on the left and drop it into the center of the view
- Click Add a caption to summarize the story point.
- To highlight a key takeaway for your viewers, drag a text object over to the story worksheet and type your comment.
- To further highlight the main idea of this story point, you can change a filter or sort on a field in the view, then save your changes by clicking Update above the navigator box.
38. What is the DRIVE Program Methodology?
Ans:
Tableau Drive is a methodology for scaling out self-service analytics. Drive is based on best practices from successful enterprise deployments. The methodology relies on iterative, agile methods that are faster and more effective than traditional long-cycle deployment.
A cornerstone of this approach is a new model of partnership between business and IT.
39. How to use group in calculated field?
Ans:
By adding the same calculation to ‘Group By’ clause in SQL query or creating a Calculated Field in the Data Window and using that field whenever you want to group the fields.
- Using groups in a calculation. You cannot reference ad-hoc groups in a calculation.
- Blend data using groups created in the secondary data source: Only calculated groups can be used in data blending if the group was created in the secondary data source.
- Use a group in another workbook. You can easily replicate a group in another workbook by copy and pasting a calculation.
40. Mention what is the difference between published data sources and embedded data sources in Tableau?
Ans:
The difference between published data source and embedded data source is that,
- Published data source: It contains connection information that is independent of any workbook and can be used by multiple workbooks.
- Embedded data source: It contains connection information and is associated with a workbook.
41. Mention what are different Tableau files?
Ans:
Different Tableau files include:
- Workbooks: Workbooks hold one or more worksheets and dashboards
- Bookmarks: It contains a single worksheet and its an easy way to quickly share your work
- Packaged Workbooks: It contains a workbook along with any supporting local file data and background images
- Data Extraction Files: Extract files are a local copy of a subset or entire data source
- Data Connection Files: It’s a small XML file with various connection information
42. How to embed views onto Webpages?
Ans:
You can embed interactive Tableau views and dashboards into web pages, blogs, wiki pages, web applications, and intranet portals. Embedded views update as the underlying data changes, or as their workbooks are updated on Tableau Server. Embedded views follow the same licensing and permission restrictions used onTableau Server. That is, to see a Tableau view that’s embedded in a web page, the person accessing the view must also have an account on Tableau Server.
Alternatively, if your organization uses a core-based license on Tableau Server, a Guest account is available. This allows people in your organization to view and interact with Tableau views embedded in web pages without having to sign in to the server. Contact your server or site administrator to find out if the Guest user is enabled for the site you publish to.
You can do the following to embed views and adjust their default appearance:
Get the embed code provided with a view: The Share button at the top of each view includes embed code that you can copy and paste into your webpage. (The Share button doesn’t appear in embedded views if you change the showShareOptions parameter to false in the code.)
Customize the embed code: You can customize the embed code using parameters that control the toolbar, tabs, and more. For more information, see Parameters for Embed Code.
Use the Tableau JavaScript API: Web developers can use Tableau JavaScript objects in web applications. To get access to the API, documentation, code examples, and the Tableau developer community, see the Tableau Developer Portal.
43. Design a view in a map such that if user selects any state, the cities under that state has to show profit and sales.
Ans:
According to your question you must have state, city, profit and sales fields in your dataset.
Step 1: Double click on the state field
Step 2: Drag the city and drop it into Marks card.
Step 3: Drag the sales and drop it into size.
Step 4: Drag profit and drop it into color.
Step 5: Click on size legend and increase the size.
Step 6: Right click on state field and select show quick filter.
Step 7: Select any state now and check the view.
44. Think that I am using Tableau Desktop & have a live connection to Cloudera Hadoop data. I need to press F5 to refresh the visualization. Is there anyway to automatically refresh visualization every ‘x’ seconds instead of pressing F5?
Ans:
Here is an example of refreshing the dashboard for every 5 seconds.
All you need to do is replace the api src and server url with yours.
45. Suppose my license expires today, will users be able to view dashboards or workbooks which I published in the server earlier?
Ans:
If your server license expires today, your username on the server will have the role ‘unlicensed’ which means you cannot access but others can. The site admin can change the ownership to another person so that the extracts do not fail.
46. Is Tableau software good for strategic acquisition?
Ans:
Yes! For sure. It gives you data insight to the extent that other tools can’t. Moreover, it also helps you to plan and point the anomalies and improvise your process for betterment of your company.
47. Can we place an excel file in a shared location and and use it to develop a report and refresh it in regular intervals?
Ans:
Yes, we can do it. But for better performance we should use Extract.
48. Can Tableau be installed on MacOS?
Ans:
Yes, Tableau Desktop can be installed on both on Mac and Windows Operating System.
49. What is the maximum no. of rows Tableau can utilize at one time?
Ans:
Tableau is not restricted by the no. of rows in the table. Customers use Tableau to access petabytes of data because it only retrieves the rows and columns needed to answer your questions.
50. When publishing workbooks on Tableau online, sometimes a error about needing to extract appears. Why does it happen occasionally?
Ans:
This happens when a user is trying to publish a workbook that is connected to an internal server or a file stored on a local drive, such as a SQL server that is within a company’s network.
I hope that this Tableau Interview Questions were helpful to you. I will be coming up with more blogs on Tableau for you all very soon.
51. Compare QlikView and Tableau
Ans:
Criteria | Tableau | QlikView |
Data integration | Exceptional | Good |
Working with multidimensional data | Very Good | Good |
Support for PowerPoint | Available | Not available |
Visual Drilldown | Good | Very Good |
Scalability | Good | Limited by RAM |
52. What is Data Visualization?
Ans:
A much advanced, direct, precise and ordered way of viewing large volumes of data is called data visualization. It is the visual representation of data in the form of graphs and charts, especially when you can’t define it textually. You can show trends, patters and correlations through various data visualization software and tools; Tableau is one such data visualization software used by businesses and corporates.
53. What are the differences between Tableau desktop and Tableau Server?
Ans:
While Tableau desktop performs data visualization and workbook creation, Tableau server is used to distribute these interactive workbooks and/or reports to the right audience. Users can edit and update the workbooks and dashboards online or Server but cannot create new ones. However, there are limited editing options when compared to desktop.
Tableau Public is again a free tool consisting of Desktop and Server components accessible to anyone.
54. Define parameters in Tableau and their working.
Ans:
Tableau parameters are dynamic variables/values that replace the constant values in data calculations and filters. For instance, you can create a calculated field value returning true when the score is greater than 80, and otherwise false. Using parameters, one can replace the constant value of 80 and control it dynamically in the formula.
55. Differentiate between parameters and filters in Tableau.
Ans:
The difference actually lies in the application. Parameters allow users to insert their values, which can be integers, float, date, string that can be used in calculations. However, filters receive only values users choose to ‘filter by’ the list, which cannot be used to perform calculations.
Users can dynamically change measures and dimensions in parameter but filters do not approve of this feature.Most in-depth, industry-led curriculum in Tableau.
56. What are fact table and Dimension table in Tableau?
Ans:
- Facts are the numeric metrics or measurable quantities of the data, which can be analyzed by dimension table. Facts are stores in Fact table that contain foreign keys referring uniquely to the associated dimension tables. The fact table supports data storage at atomic level and thus, allows more number of records to be inserted at one time. For instance, a Sales Fact table can have product key, customer key, promotion key, items sold, referring to a specific event.
- Dimensions are the descriptive attribute values for multiple dimensions of each attribute, defining multiple characteristics. A dimension table ,having reference of a product key form the fact table, can consist of product name, product type, size, color, description, etc.
57. What are Quick Filters in Tableau?
Ans:
Global quick filters are a way to filter each worksheet on a dashboard until each of them contains a dimension. They are very useful for worksheets using the same data source, which sometimes proves to a disadvantage and generate slow results. Thus, parameters are more useful.
58. State limitations of parameters in Tableau.
Ans:
Parameters facilitate only four ways to represent data on a dashboard (which are seven in quick filters). Further, parameters do not allow multiple selections in a filter.
59. What is Data Blending?
Ans:
Unlike Data Joining, Data Blending in tableau allows combining of data from different sources and platforms. For instance, you can blend data present in an Excel file with that of an Oracle DB to create a new dataset.
60. What is Content Filter?
Ans:
The concept of context filter in Tableau makes the process of filtering smooth and straightforward. It establishes a filtering hierarchy where all other filters present refer to the context filter for their subsequent operations. The other filters now process data that has been passed through the context filter.
Creating one or more context filters improves performance as users do not have to create extra filters on large data source, reducing the query-execution time.
You can create by dragging a filed into ‘Filters’ tab and then, Right-Click that field and select ‘’Add to Context”
61. What are the limitations of context filters?
Ans:
Tableau takes time to place a filter in context. When a filter is set as context one, the software creates a temporary table for that particular context filter. This table will reload each time and consists of all values that are not filtered by either Context or Custom SQL filter.
62. Name the file extensions in Tableau.
Ans:
There are a number of file types and extensions in Tableau :
- Tableau Workbook (.twb).
- Tableau Packaged Workbook (.twbx).
- Tableau Datasource (.tds).
- Tableau Packaged Datasource (.tdsx).
- Tableau Data extract (.tde).
- Tableau Bookmark (.tdm).
- Tableau Map Source (.tms).
- Tableau Preferences (.tps)
63. What are Extracts and Schedules in Tableau server?
Ans:
Data extracts are the first copies or subdivisions of the actual data from original data sources. The workbooks using data extracts instead of those using live DB connections are faster since the extracted data is imported in Tableau Engine.After this extraction of data, users can publish the workbook, which also publishes the extracts in Tableau Server. However, the workbook and extracts won’t refresh unless users apply a scheduled refresh on the extract. Scheduled Refreshes are the scheduling tasks set for data extract refresh so that they get refreshed automatically while publishing a workbook with data extract. This also removes the burden of republishing the workbook every time the concerned data gets updated.
64. What is Page shelf?
Ans:
Tableau provides a distinct and powerful tool to control the output display known as Page shelf. As the name suggests, the page shelf fragments the view into a series of pages, presenting a different view on each page, making it more user-friendly and minimizing scrolling to analyze and view data and information. You can flip through the pages using the specified controls and compare them at a common axle.
65. Explain the concept of Dual Axis.(repeated)
Ans:
Dual Axis is an excellent phenomenon supported by Tableau that helps users view two scales of two measures in the same graph. Many websites like Indeed.com and other make use of dual axis to show the comparison between two measures and their growth rate in a septic set of years. Dual axes let you compare multiple measures at once, having two independent axes layered on top of one another.
66. What different products Tableau provide?
Ans:
Tableau Server : on-premise or cloud-hosted software to access the workbooks built.
Tableau desktop : desktop environment to create and publish standard and packaged workbooks.
Tableau Public : workbooks available publicly online for users to download and access the included data.
Tableau Reader : get a local access to open Tableau Packaged workbook
67. How to use group in calculated field?
Ans:
By adding the same calculation to ‘Group By’ clause in SQL query or creating a Calculated Field in the Data Window and using that field whenever you want to group the fields.
- Using groups in a calculation. You cannot reference ad-hoc groups in a calculation.
- Blend data using groups created in the secondary data source: Only calculated groups can be used in data blending if the group was created in the secondary data source.
- Use a group in another workbook. You can easily replicate a group in another workbook by copy and pasting a calculation.
68. Can parameters have dropdown list?
Ans:
Yes, parameters do have their independent dropdown lists enabling users to view the data entries available in the parameter during its creation.
69. What is the difference between Quick Filter, Normal filter and Context filter?
Ans:
In Tableau, filters are used to restrict the data from database. The differences between Quick and Normal/ Traditional filter are:
- Normal Filter is used to restrict the data from database based on selected dimension or measure. A Traditional Filter can be created by simply dragging a field onto the ‘Filters’ shelf.
- Quick filter is used to view the filtering options and filter each worksheet on a dashboard while changing the values dynamically (within the range defined) during the run time.
- Context Filter is used to filter the data that is transferred to each individual worksheet. When a worksheet queries the data source, it creates a temporary, flat table that is uses to compute the chart. This temporary table includes all values that are not filtered out by either the Custom SQL or the Context Filter.
70. What is data blending? When do you use this?
Ans:
According to Tableau, Data blending is the ability to bring data from multiple data sources into one Tableau view, without the need for any special coding.
You can use data blending in Tableau in the following cases:
- Filter on secondary dimension fields
- Use secondary dimensions in the view
- Link data between two data sources using fields that are not in the view
If you are combining data from the same data source, such as Excel worksheets or tables in an Oracle database, you use joining.
Name the file extensions in Tableau.
There are a number of file types and extensions in Tableau:
- Tableau Workbook (.twb)
- Tableau Packaged Workbook (.twbx)
- Tableau Data Source (.tds)
- Tableau Packaged Datasource (.tdsx)
- Tableau Data extract (.tde)
- Tableau Bookmark (.tdm)
- Tableau Map Source (.tms)
- Tableau Preferences (.tps)
71. What are the differences between groups and sets?
Ans:
Groups simplify large numbers of dimension members by combining them into higher-level categories. Sets create a custom field based on existing dimensions that can be used to encode the view with multiple dimension members across varying dimension levels.
72. How do we do testing in Tableau?
Ans:
You can do performance testing on Tableau with Tableau Server load-testing solution called TabJolt. You can use Tab Jolt to push a heavy workload onto Tableau Server to give it a jolt and study how the server bends or breaks under load.
73. How do you automate reports using Tableau software?
Ans:
This is how you can automate the reports: while publishing the report to Tableau server, you will find the option to schedule reports. Click on this to select the time when you want to refresh the data.
74. How can we combine database and flat file data in Tableau desktop?
Ans:
You can combine them by connecting data two times, one for database tables and one for flat file. The Data->Edit Relationships. Give a join condition on common column from db tables to flat file.
75. What are the platforms Tableau server can run on?
Ans:
Tableau server can run on Windows and Mac.
76. Does Tableau integrate with Hadoop/Hive Server?
Ans:
Tableau can only integrate with HiveServer, not Hadoop.
77. How do you normalize data for use in Tableau?
Ans:
When an Excel data source (other than a cube) is already formatted as a cross-tabulation or is otherwise aggregated, options for viewing, aggregating, and grouping in Tableau are limited. Tableau cannot see underlying data points that have already been summarized into a higher-level group or order. To take advantage of Tableau’s full functionality, you need to normalize the data before connecting to it from Tableau.
78. Explain and implement a serialization of a binary tree.
Ans:
You can write serialization for leaf nodes, and then for parent nodes.
Recursive map: {value: [serialize(left), serialize(right)]}, where serialized leaf is null.
79. Can parameters have drop down list?
Ans:
Yes, parameters do have their independent dropdown lists enabling users to view the data entries available in the parameter during its creation.
80. What are differences between Tableau’s Desktop/Online versions?
Ans:
- Tableau Desktop is used to visualize and analyze data, create workbooks, visualizations, dashboards and stories.
- Tableau Desktop Professional (but not Desktop Personal) can then publish these to Tableau Server, Tableau Online and Tableau Public.
- Tableau Server and Tableau Online allow you to safely distribute the interactive workbooks to the right people. You can edit workbooks, visualizations, dashboards and stories in Server or Online, but you can’t produce new ones. The editing options are limited compared to the Desktop.
- Server and Online can be used as high-performance data repositories for Desktop users.
- Tableau Public is a free tool that is intended for people who want to publish information, accessible to anyone. There are both a Desktop and Online components.
81. What is the major functionality difference between Tableau desktop and Tableau Server?
Ans:
Tableau Desktop and Server we need to understand their key functionality.
Tableau Desktop and Tableau Server | |
Tableau Desktop | This is where reports/dashboards are being created connecting to the respective data sources |
Tableau Server | This is where the reports/dashboards are being published for others to view |
82. List out some of the new features introduced in Tableau 9.1?
Ans:
The new features introduced in Tableau 9.1 includes
Data: With new web data connector, it makes data accessible from anywhere
Mobile: The new tableau comes with a high-resolution thumbnails, taking screenshot offline and high-level security for the data
Enterprise: Easy enterprise deployment with active directory synchronization
Visual Analytics: View proximity in the radial selection tool, also provides features like creating filter formulas and Zoom control on your data
83. Mention when to use Joins vs. Blending in Tableau?
Ans:
If data resides in a single source, it is always desirable to use Joins. When your data is not in one place blending is the most viable way to create a left join like the connection between your primary and secondary data sources.
84. Do you know the difference between Live Data and Extract Data in Tableau?
Ans:
The best answer to this question: An ‘extract’ connection is a connection with a static database, which is refreshed every day/hour/period. In this case all data are copied from the data source to the Tableau Server. Refreshing the data source will not give you the latest data – you have to refresh the extract to get them.
A live connection will query the underlying data in the data source/database – refreshing the visualization will give you the latest results. In this case no data is copied to Tableau Server for pre-processing.
Name a few of the different types of filters used in tableau.
The best answer to this question:
The 3 types of Filters in Tableau are:
- Quick Filter
- Data Source Filter
- Context Filter
85. Can you tell me the difference between parameters and filters in Tableau?
Ans:
The best answer to this question: The difference actually lies in the application. Parameters allow users to insert their values these can be float, integers, string, date that can be used in calculations. However, filters receive only values users choose to ‘filter by’ the list this cannot be used to perform calculations.
Users can dynamically change measures and dimensions in parameter but filters do not support of this feature.
86. What is the difference between context filter to other filters?
Ans:
Whenever we crate context filter
- Tableau will create a temporary table for this particular filter set and other filters will be apply on context filter data like cascade parameters… suppose we have crated context filter on countries >> we have chosen country as USA and India
- Tableau will create a temporary table for this two countries data and if you have any other filers >>other will be apply on this two countries data if we don’t have any context filter
- Each and individual record will check for all filters
87. What is disadvantage of context filters?
Ans:
- The context filter is not frequently changed by the user – if the filter is changed the database must recomputed and rewrite the temporary table, slowing performance.
- When you set a dimension to context, Tableau crates a temporary table that will require a reload each time the view is initiated. For Excel, Access and text data sources, the temporary table created is in an Access table format. For SQL Server, My SQL and Oracle data sources, you must have permission to create a temporary table on your server. For multidimensional data source, or cubes, temporary tables are not crated, and context filters only defined which filters are independent and dependent.
88. What are the five main product offered by Tableau company?
Ans:
Tableau offers five main products: Tableau Desktop, Tableau Server, Tableau Online, Tableau reader and Tableau Public.
89. What is the current latest version of Tableau Desktop(as of Sep, 25th 2017)?
Ans:
Current version: Tableau Desktop Version 10.4
90. Why tableau?
Ans:
Whether your data is in an on-premise database, a database, a data warehouse, a cloud application or an Excel file, you can analyze it with Tableau. You can create views of your data and share it with colleagues, customers, and partners. You can use Tableau to blend it with other data. And you can keep your data up to date automatically.
91. Can we use non – used columns (Columns which are not used in reports but data source has columns) in Tableau Filters?
Ans:
Yes!
Ex. In data source I have column like
empID, EmpName, EmpDept,EmpDsignation, EmpSalary
In reports I am using empname on columns and empsalry on rows.
I can use empDesignation on Filters
92. How to combine two excel files with same fields but different data (different years)?
Ans:
I have 5 different excel files (2007.xls, 2008.xls..2011.xls) with same fields (film name, genre, budge, rating, profitability) but with data from different year (2007 to 2011). Can someone tell me how can I combine the film name, genre and profitability so that I can see the visualization of 2007 to 2011 in a single chart?
93. What makes Tableau software stand out?
Ans:
In my view, Tableau stands out for several reasons:
First, most of the BI tools out there are pricey. However, Tableau has a free offering (Tableau Public) as well as a very popular (also free) academic distribution. Tableau is well recognized by firms like Forrester research to be one of the most easy to use, and agile products currently available. see here: Tableau Ranks #1 in The Forrester Wave: Advanced Data Visualization (ADV) Platforms That makes it easy to pick up and try new things with, which data visualization people love about it.
On the other hand, unlike some of the other BI tools, Tableau is not a complete technology stack, it is most useful for visualization and analytics. – you will need other products in addition to tableau for heavier enterprise data ETL, maintenance, and storage, etc.
94. Can you get values from two different sources as a single input into parameter?
Ans:
Tableau currently not support the multi-valued parameters… “Case Study: The “dynamic parameter with a blend” technique can be used to highlight a single value, but not multiple values because of the way it works. As Tableau parameters are not dynamic, we cannot “filter” the list of values at runtime.”
95. How many ways we use parameters in Tableau?
Ans:
We can use parameters with filters, calculated fields ,actions, measure-swap, changing views and auto updates
96. What are the similarities and differences between Tableau software and Palantir?
Ans:
Palantir and Tableau are very different. Palantir has its roots in large data computer science problems involving security, payments, fraud detection and the likes. Customers/Investors include Paypal, CIA and others.
Tableau is a visualization player – with roots in Stanford U research. It’s Visual Query Language (VizQL) allows users to build visualizations on top of standard data warehouses or spreadsheets.
97. How to create cascading filters without context filter ?
Ans:
I have filterl and filter2..Based on filterl I need to filter2 data
Ex: Filterl as Country and Filter 2: States
I have chosen country as INDIA and filter2 should display only INDIA states
Choose options of Filter2 states :
select option of “Only relevant values “
98. How to display top 5 and last 5 sales in same view?
Ans:
Using filters or calculated fields we can able to display the top 5 and last 5 sales in same view.
99. Design a view to show region wise profit and sales.I did not want line and bar chat should be used for profit and sales. How you will design and please explain?
Ans:
Generate the Map using cities –>then Drag the Profit and sales to the Details–>Add the state as Quick filter
100. What Does TABLEAU do?
Ans:
Our goal is to help people see and understand data. Our software products put the power of data into the hands of everyday people, allowing a broad population of business users to engage with their data, ask questions, solve problems and create value.
101. What is your daily work process in tableau?
Ans:
I think we all work on different projects using Tableau, so the work begins from understanding the requirement getting the required data, story boarding then creating visualizations in tableau and then presenting it to the client for review.
102. What is parameter in Tableau ? And how it works.?
Ans:
Parameters are dynamic values that can replace constant values in calculations and can serve as filters
103. How does Tableau perform with huge datasets?
Ans:
Tableau Performance is based on Data source performance. If data source takes more time to execute a query then Tableau must wait up to that time.
104. How will you publish and schedule workbook in tableau server?
Ans:
First create a schedule for particular time and then create extract for the data source and publish the workbook for the server. Before you publish, there is a option called Scheduling and Authentication, click on that and select the schedule from the drop down which is created and publish. Also publish data source and assign the schedule. This schedule will automatically run for the assigned time and the workbook is refreshed.
105. What are the major differences between tableau version 7.0 and tableau version 8.0?
Ans:
- New visualizations are introduced like treemap, bubble chart and box and whisker plot
- We can copy worksheet directly from one workbook to another workbook
- Introduced R script
106. How to create filled maps?
Ans:
Step 1: Build a Map View Double-click a geographic fields such as State, Area Code, Zip Code, etc.
Step 2: Select the Fille Map Mark Type The Automatic mark type will show this type of view as circles over a map. On the Marks card, select Filled Map to color the geographic areas.
Step 3: Drag a Field to the Color Shelf Define how the locations are colored by dragging another field to the Color shelf.
107. Explain the integration of Tableau with R?
Ans:
R is a popular open-source environment for statistical analysis. Tableau Desktop can now connect to R through calculated fields and take advantage of R functions, libraries, and packages and even saved models. These calculations dynamically invoke the R engine and pass values to R via the Rserve package, and are returned back to Tableau.
1. Tableau Server can also be configured to connect to an instance of Rserve through the tabadmin utility, allowing anyone to view a dashboard containing R functionality.
2. Combining R with Tableau gives you the ability to bring deep statistical analysis into a drag-and-drop visual analytics environment.
108. How is Tableau so fast when working with databases?
Ans:
Tableau compiles the elements of your visual canvas into a SQL or MDX query for the remote database to process. Since a database typically runs on more powerful hardware than the laptops / workstations used by analysts, you should generally expect the database to handle queries much faster than most in memory BI applications limited by enduser hardware. Tableau’s ability to push computation (queries) close to the data is increasingly important for large data sets, which may reside on a fast cluster and may be too large to bring in memory.Another factor in performance relates to data transfer, or in Tableau’s case resultset transfer. Since Tableau visualizations are designed for human consumption, they are tailored to the capabilities and limits of the human perception system. This generally means that the amount of data in a query result set is small relative to the size of the underlying data, and visualizations focus on aggregation and filtering to identify trends and outliers. The small result sets require little network bandwidth, so Tableau is able to fetch and render the result set very quickly. And, as Ross mentioned, Tableau will cache query results for fast reuse.The last factor involves Tableau’s ability to use in memory acceleration as needed (for example, when working with very slow databases, text files, etc.). Tableau’s Data Engine uses memory mapped I/O, so while it takes advantage of in memory acceleration it can easily work with large data sets which cannot fit in memory. The Data Engine will work only with the subsets of data on disk which are needed for a given query, and the data subsets are mapped into memory as needed.
109. Explain the features of Tableau 8.3?
Ans:
With Kerboros support, Tableau 8.3 advances enterprise-grade data analysis with these enhancements:
1. Provides seamless, single sign-on experience from Tableau client to back-end data sources
2. Protects sensitive data with delegated access and viewer credential management
3. Connects to live data sources through stable, automated back-end authentication
4. Leverages existing IT investments in enterprise-grade authentication and data security
5. Supports smart card authentication
110. What is Metadata?
Ans:
The Descriptive information about the information system and its contents is known as metadata. It defines the type of data we are storing.
111. How can you display top five and last five sales in the same view?
Ans:
Create two sets, one for top 5 another for bottom 5 and the join these two sets displaying a unique set of total 10 rows.
112. Mention what are the characteristics to distinguish data source?
Ans:
The data source are distinguished on the basis of following characteristics
- Icon/Name
- Connection Type
- Connects to
- Live or Last extract
113. What is TDE file?
Ans:
TDE is a Tableau desktop file that contains a .tde extension. It refers to the file that contains data extracted from external sources like MS Excel, MS Access or CSV file.
There are two aspects of TDE design that make them ideal for supporting analytics and data discovery.
Firstly, TDE is a columnar store.
The second is how they are structured which impacts how they are loaded into memory and used by Tableau. This is an important aspect of how TDEs are “architecture aware”. Architecture-awareness means that TDEs use all parts of your computer memory, from RAM to hard disk, and put each part to work what best fits its characteristics.
About the author
Leave a Reply Cancel reply
This site uses Akismet to reduce spam. Learn how your comment data is processed.